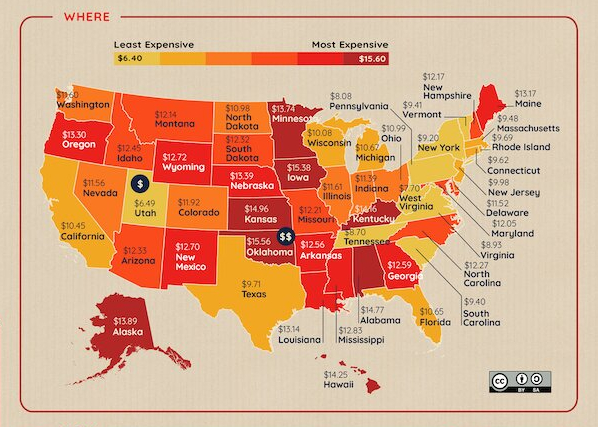
More for the sake of feeding curiosity than providing essential economic information, we present the 2021 U.S. Pizza Price Index. And the data show there’s a serious disparity in pie affordability across the national map. I wonder if this is indicative of differences in the pies themselves from region to region?

First, the hard numbers
The survey, by Expensivity, reveals a difference of just over $9 between the highest and the lowest state-wide average prices for standard, baseline Pepperoni Pizzas. That seems like a big disparity, given that just a few commercial suppliers provide ingredients for the majority of pie purveyors (certainly for the big chains, which are represented in almost every state of the Union), and you’d assume that their wholesale prices are pretty much the same, region to region.
What’s going on?
So, what is the true underlying cause of this huge difference in pizza prices? Could be a number of forces at work. We can assume that rents for restaurant space and utilities vary not only from state to state, but from city to city. Not to mention business and sales taxes. Then, there’s the vast range of state-mandated minimum wage levels. And that’s just the start.
But I have a theory that something else – something largely unsuspected or unregarded by pollsters and economists – is making a significant contribution to the disparity in pizza prices.
Micro variables may have macro effects
Like all food-level restaurant issues, there’s a certain amount of variance in portion sizes. Even at fast food joints, where every penny counts on the profit line, some operators fill Fry sleeves fuller than others. Unless ingredients are pre-measured precisely, you’ll find some variance burger-to-burger in the amount of toppings applied. And one can easily apply that principle to pizzas.
How do they like their pies in one state versus another? Do pizza makers in some places traditionally lavish more cheese on their pies than those in others? What’s the diameter of the pepperoni slices on a given pie? The thickness? The number of pieces used per pie? Cheese and Pepperoni are both relatively high-cost ingredients, and what might look like a small difference in the amounts used may add up to a significant difference in cost that’s reflected in the retail prices of the pies.
Here’s another cost factor not addressed in the Expensivity survey: Are we talking regular- or thin-crust pies? I’ve watched pizzaiolos making pies in kitchens where both types of crust are offered. The dough balls used for thin-crust pizzas are often less than half the size of those for regular-crust pies of the same diameter.
So… Is the Expensivity index really valid?
Expensivity reports that the average price of a pepperoni pizza is highest in Oklahoma, at $15.56, and the lowest is just $6.49, in Utah – just a couple of states away, geographically. Even in Alaska – where everything co0sts more because it has to be shipped up from the south – the average price of a pepperoni pizza is just $13.89. In New England, the price is universally right around $9.50. The median price across the land is roughly $12.50.
The minority report
Whatever the physical variances in the different pies from different parts of the country, I must – to be fair – note that a pepperoni pizza is what it is, wherever you find it. It’s well known that folks in New England love their ‘New York Style’ thin-crust pizza. But in Chicago, they prefer thicker crusts; so much so that the city is known as the home of the Deep Dish Pizza. And you’ll find similar regional preferences all across the U.S. As those who disagree with me are quick to point out, the pizzas found in any region are what consumers in that region consider ‘proper pizzas’. And the prices they’re used to paying for them are considered the fair, usual prices in their individual locations.
So it may be argued that the simple difference in prices for different regional pizza ‘products’ is a moot point.
Nevertheless…
I say the 2021 Expensivity Index raises more questions than it answers. And I wonder if the company couldn’t structure their survey to take into account some of the variables I’ve mentioned above in time for the 2022 survey. I really do feel that simply reporting what people pay for a pie from state to state is far less important than a proper, more-detailed analysis that yields a true comparison of what you get for what you pay for a pizza, wherever you are. That’s the only way consumers can identify bargains or, conversely, ripoffs across the map.
~ Maggie J.

