It’s actually the annual Technomics ‘Top 500 Top Chain Restaurant Report’. And it’s more a confirmation of the status quo than a stunning revelation. The trouble is… Which market metric means more?
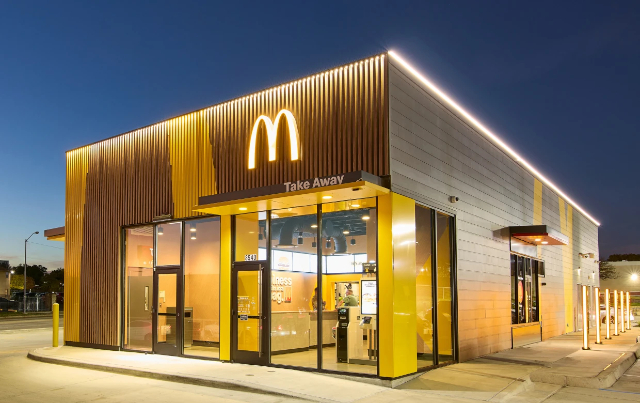 The McDonald’s of the Future: The market leader’s next step in maintaining
dominance over the fast Food Industry. McD’s was once again
crowned ‘King of Burgers’ (sorry, Burger King)..
The Technomics report is an anxiously awaited annual event in the Fast Food sector. It’s billed as the ‘Top 500’, but that just about takes in all the US Fast Food joints with more than one location. Nevertheless, the very top of the list can be considered a definitive statement on the state of the industry.
Few surprises…
The 2023 Top 10 – a Who’s Who of the monster brands – was little changed from last year:
| Company | ||||
| 1 | McDonald’s | |||
| 2 | Starbucks | |||
| 3 | Chick-Fil-A | |||
| 4 | Taco Bell | |||
| 5 | Wendy’s | |||
| 6 | Dunkin’ | |||
| 7 | Burger King | |||
| 8 | Subway | |||
| 9 | Chipotle Mexican Grill | |||
| 10 | Domino’s |
As you may have guessed, the ranking is based on total chain market share. And those figures don’t necessarily correspond to the ‘size’ of each chain based on the number of locations each operates…
Not intuitive
You’d think that the chain with more outlets would have higher revenues. Not so! The latest update of the ‘master list’ of Fast Food brands on Wikipedia tells a disparate story:
| Home | Company | Total Locations | Annual Revenue | |
| 1 | United States | McDonald’s | 40,275 (2022)[1] | US$23.2 billion (2021)[1] |
| 2 | United States | Subway | 36,999 (2021)[2][3] | US$16.1 billion (2020)[4] |
| 3 | United States | Starbucks | 36,170 (2023)[5] | US$32.3 billion (2022)[6] |
| 5 | United States | KFC | 26,934 (2021)[8][9] | US$31.3 billion (2021)[8] |
| 6 | United States | Burger King | 19,247 (2021)[10][11] | US$23.4 billion (2021)[10] |
| 7 | United States | Pizza Hut | 18,848 (2021)[8] | US$17.7 billion (2021) |
| 8 | United States | Domino’s | 18,381 (2021)[12][13][14] | US$12.9 billion (2021)[12] |
| 10 | United States | Dunkin’ | 11,300[17] | US$1.37 billion (2020)[18] |
| 11 | United States | Krispy Kreme | 10,427 (2021)[19][20] | US$1.38 billion (2021)[19] |
| 12 | United States | Hunt Brothers Pizza | 8,000+ (2021)[19][20] | US$1.38 billion (2021)[19] |
| 13 | United States | Taco Bell | 7,791 (2021)[8][22] | US$13.2 billion (2021)[8] |
| 13 | United States | Orange Julius | 7,000+[23] | |
| 14 | United States | Dairy Queen | 7,000+[23] | |
| 15 | United States | Wendy’s | 6,949 (2021)[24] | US$12.5 billion (2021)[24] |
Confused? Me, too…
For one thing, no matter how you read the figures, McDonald’s still controls a whopping (sorry, BK) 41 percent share of the market. And taken together, the Top 10 brands account for a substantial 44 percent of annual Fast Food sales.
Some of the chains placed higher in Market Share than their Revenues or ‘Footprint’ would suggest. Industry observers agree that simply indicates they sold more food at higher prices than the competition.
Oh, yah… Chipotle was the brand upon which a little glory shone. It jumped from 10th spot in 2022 to 9th in 2023.
My take
If you have $2 million or so lying around and have been thinking of buying a Fast Food franchise, I’d go for the one with the ones with the strongest market share growth this past year: Chipotle (15.3 percent), Chick-Fil-A (14.7 percent) or Starbuck’s (12.5 percent)…
~ Maggie J.